This guide teaches you how to create high-performance CSS animations.
See Why are some animations slow? to learn the theory behind these recommendations.
Browser compatibility
All the CSS properties that this guide recommends have good cross-browser support.
transform
opacity
will-change
Move an element
To move an element, use the translate or rotation keyword values of the
transform property.
For example, to slide an item into view, use translate.
.animate {
  animation: slide-in 0.7s both;
}

@keyframes slide-in {
  0% {
    transform: translateY(-1000px);
  }
  100% {
    transform: translateY(0);
  }
}
Use rotate to rotate elements. The following example rotates an element
360 degrees.
.animate {
  animation: rotate 0.7s ease-in-out both;
}

@keyframes rotate {
  0% {
    transform: rotate(0);
  }
  100% {
    transform: rotate(360deg);
  }
}
Resize an element
To resize an element, use the scale keyword value of the
transform property.
.animate {
  animation: scale 1.5s both;
}

@keyframes scale {
  50% {
    transform: scale(0.5);
  }
  100% {
    transform: scale(1);
  }
}
Change an element's visibility
To show or hide an element, use opacity.
.animate {
  animation: opacity 2.5s both;
}

@keyframes opacity {
  0% {
    opacity: 1;
  }
  50% {
    opacity: 0;
  }
  100% {
    opacity: 1;
  }
}
Avoid properties that trigger layout or paint
Before using any CSS property for animation (other than transform and opacity),
determine the property's impact on the rendering pipeline.
Avoid any property that triggers layout or paint unless it's absolutely necessary.
Force layer creation
As explained in Why are some animations slow?, placing elements on a new layer lets the browser repaint them without needing to repaint the rest of the layout.
Browsers can usually make good decisions about which items should be placed on a
new layer, but you can manually force layer creation with the
will-change property.
As the name suggests, this property tells the browser that this element is going
to be changed in some way.
In CSS, you can apply will-change to any selector:
body > .sidebar {
  will-change: transform;
}
However, the specification
suggests that you should only do this for elements that are always about to
change. For example, this might be true for a sidebar the user can slide in and
out. For elements that don't change frequently, we recommend applying
will-change using JavaScript when a change is likely to happen. Make sure to
give the browser enough time to perform the necessary optimizations, and remove
the property when the change has stopped.
If you to force layer creation in a browser that doesn't support will-change
(most likely Internet Explorer), you can set transform: translateZ(0).
Debug slow or glitchy animations
Chrome DevTools and Firefox DevTools have lots of tools to help you figure out why your animations are slow or glitchy.
Check whether an animation triggers layout
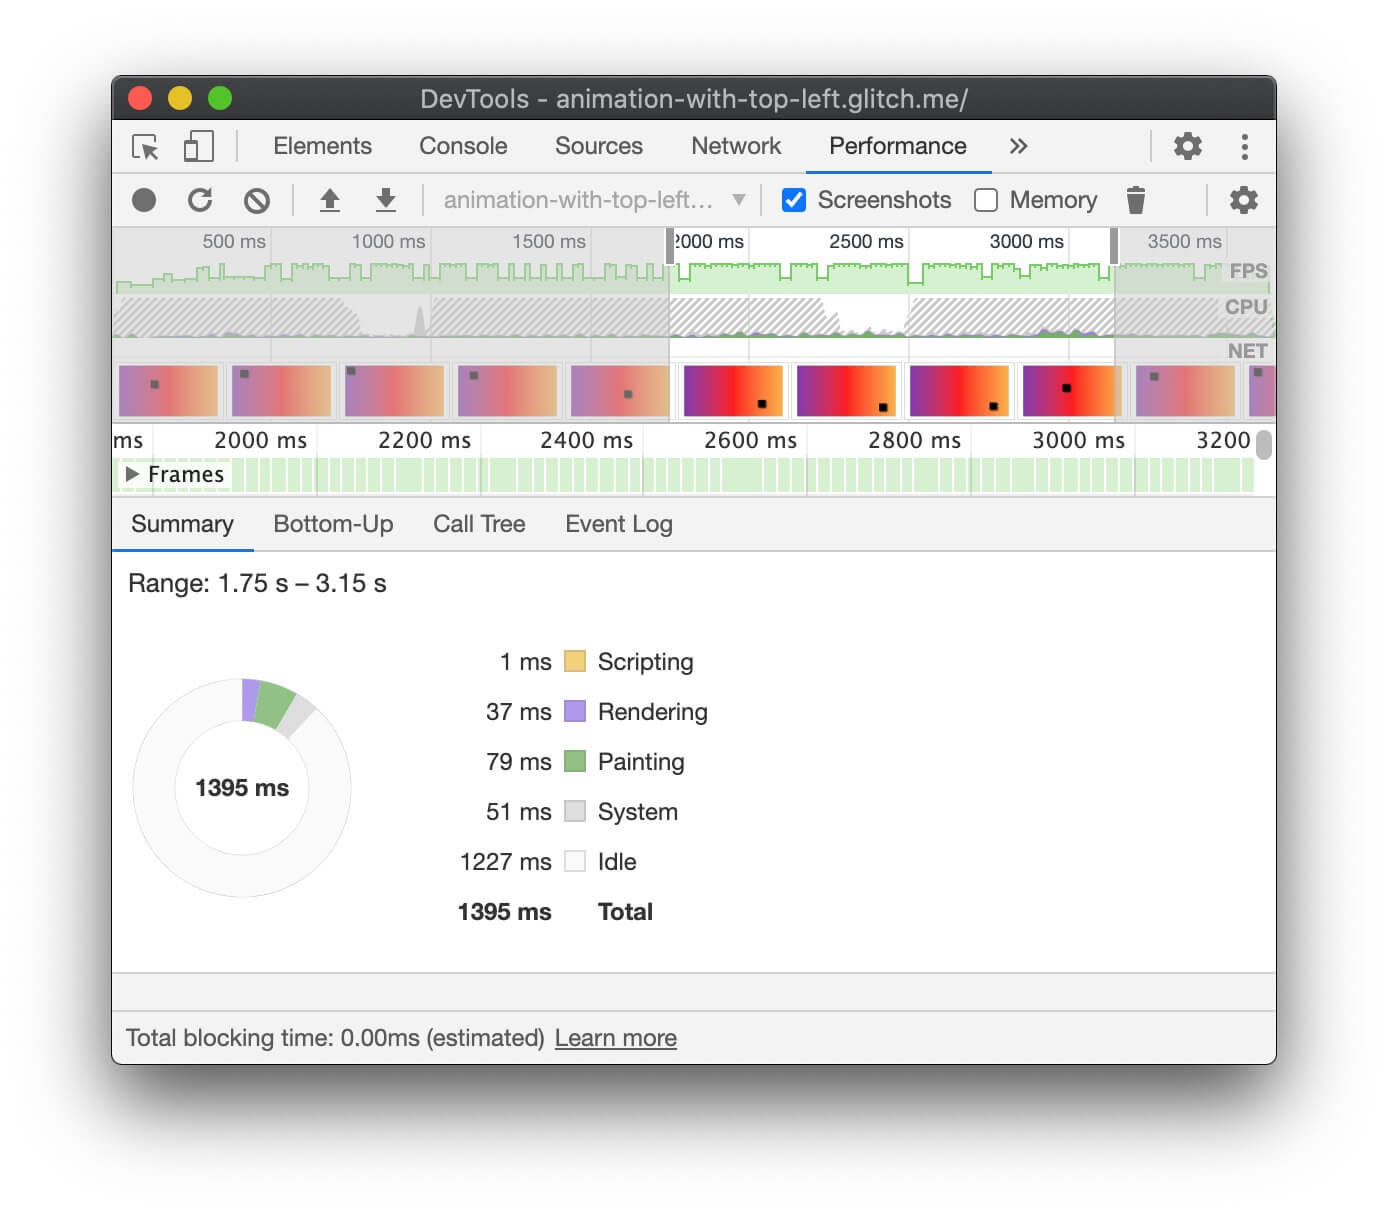
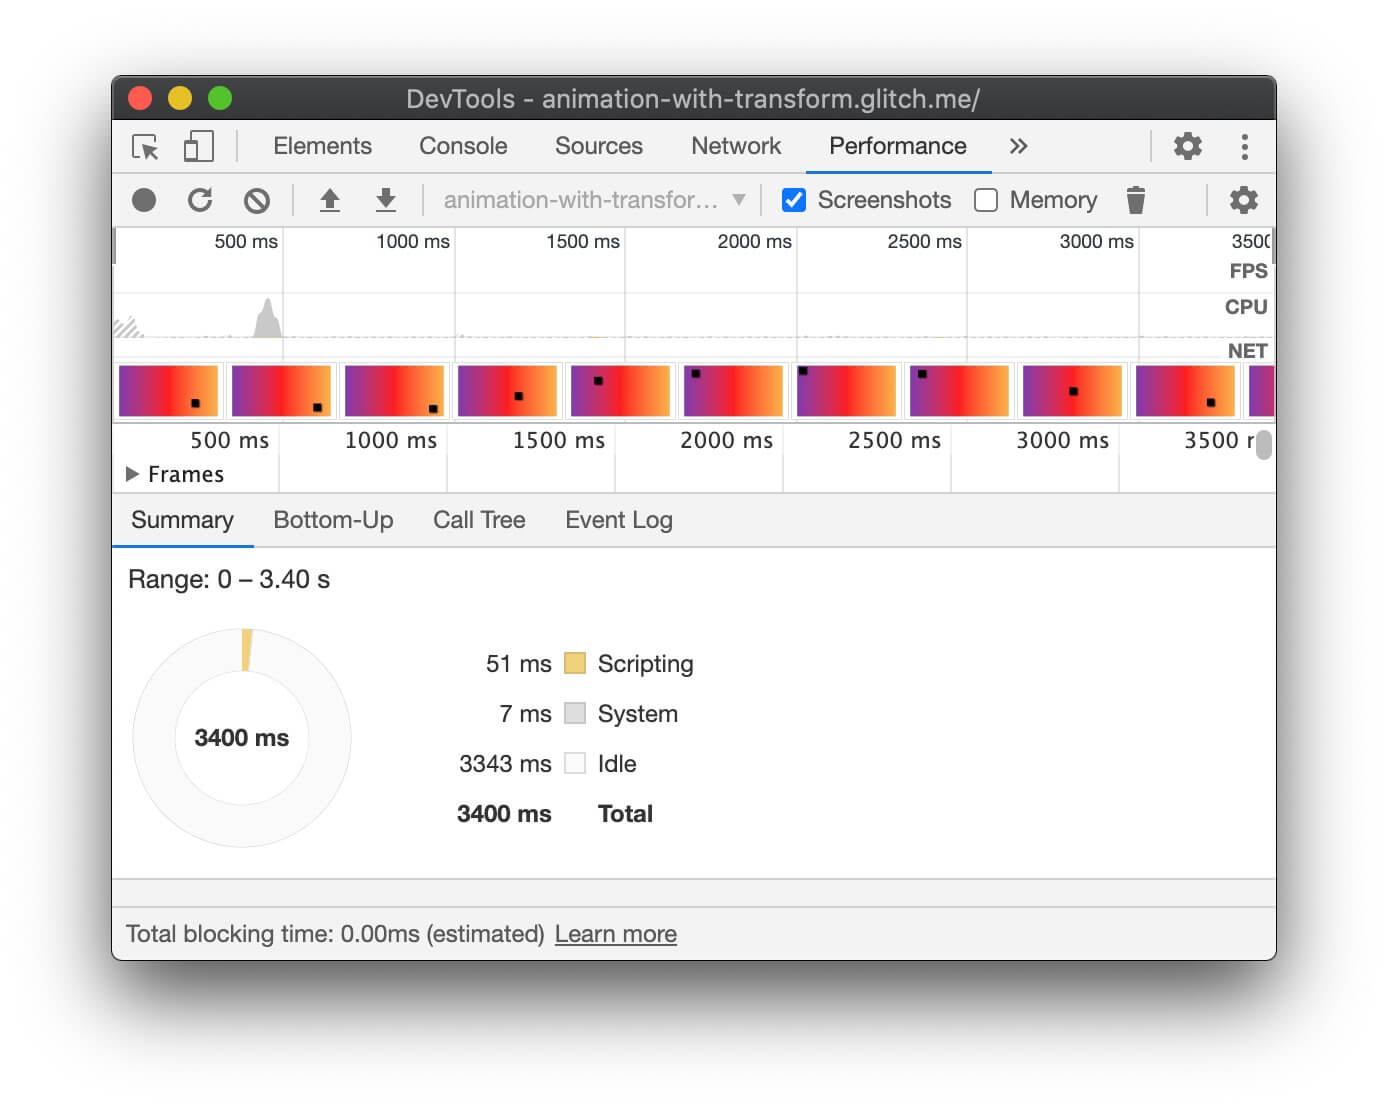
An animation that moves an element using something other than transform is
likely to be slow. The following example compares an animation using transform
to an animation using top and left.
.box {
  position: absolute;
  top: 10px;
  left: 10px;
  animation: move 3s ease infinite;
}

@keyframes move {
  50% {
     top: calc(90vh - 160px);
     left: calc(90vw - 200px);
  }
}
.box {
  position: absolute;
  top: 10px;
  left: 10px;
  animation: move 3s ease infinite;
}

@keyframes move {
  50% {
     transform: translate(calc(90vw - 200px), calc(90vh - 160px));
  }
}
You can test this in the following two Glitch examples, and explore performance using DevTools.
Chrome DevTools
- Open the Performance panel.
- Record runtime performance while your animation is happening.
- Inspect the Summary tab.
If you see a nonzero value for Rendering in the Summary tab, it might mean your animation is making the browser do layout work.


Firefox DevTools
In Firefox DevTools the Waterfall can help you understand where the browser is spending time.
- Open the Performance panel.
- Start recording performance while your animation is happening.
- Stop the recording and inspect the Waterfall tab.
If you see entries for Recalculate Style, that means the browser has to return to the start of the rendering waterfall to render the animation.
Check for dropped frames
- Open the Rendering tab in Chrome DevTools.
- Enable the FPS meter checkbox.
- Watch the values while your animation runs.
Pay attention to the Frames label at the top of the FPS meter UI.
This shows values like 50% 1 (938 m) dropped of 1878. A high-performance
animation has a high percentage, such as 99%, meaning that few frames are
being dropped and the animation looks smooth.


Check whether an animation triggers paint
Some properties are more expensive for the browser to paint than others. For example, anything that involves a blur (like a shadow, for example) takse longer to paint than drawing a red box. These differences aren't always obvious in the CSS, but browser DevTools can help you to identify which areas need to be repainted, as well as other painting-related performance issues.
Chrome DevTools
- Open the Rendering tab in Chrome DevTools.
- Select Paint Flashing.
- Move the pointer around the screen.

If you see the whole screen flashing, or areas highlighted that you don't think should change, investigate further.
If you need to determine whether a particular property is causing painting-related performance issues, the paint profiler in Chrome DevTools can help.
Firefox DevTools
- Open Settings and add a Toolbox button for Toggle paint flashing.
- On the page you want to inspect, toggle the button on and move your mouse or scroll to see highlighted areas.
Conclusion
Where possible, restrict animations to opacity and transform to keep
animations on the compositing stage of the rendering path. Use DevTools to check
which stage of the path is being affected by your animations.
Use the paint profiler to see if any paint operations are particularly expensive. If you find anything, check whether a different CSS property gives the same look and feel with better performance.
Use the will-change property sparingly, and only if you encounter a performance issue.


